Monitoring and Alerting: Ultimate Guide to Choose the Right Tool

Is your system ready to handle high traffic? What is your website’s load time? Is threshold 5–10% optimal for Error 500? To answer these questions, you need monitoring and observability.
This DevOps solution help to detect problems and fix them in time, ideally before they affect end-users. Monitoring is gathering logs and metrics to analyze the health of your systems. White-box monitoring observes the internal state, and black-box monitoring looks at external systems’ behavior. Observability allows teams to actively debug repeated issues and explore patterns not defined in advance.
Metrics
The ideal monitoring system answers what’s broken and why at any time. What metrics can help you understand the environment’s health? Here are the essential ones:

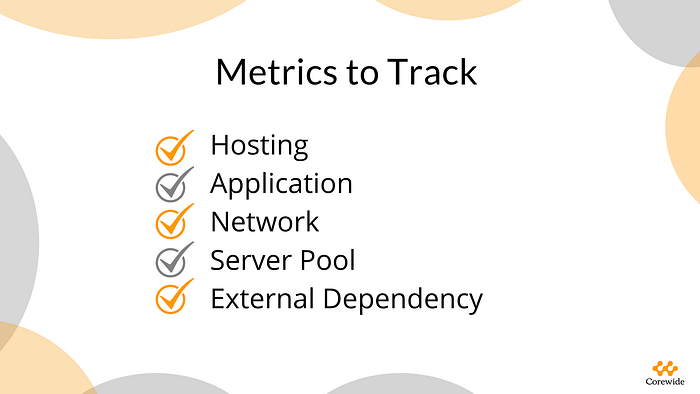
- Hosting metrics (Processes, CPU, RAM, Disk Space and I/O)
- App metrics (Resource usage, Error/Success rates, Errors codes, Response performance, Failures/Restarts)
- Network metrics (Established/Broken connections rate, Traffic, Network cards, Certificates)
- Server Pool metrics (Resource usage, Scaling adjustment)
- External Dependency metrics (Service status and availability, Operational costs)
Visualizing received information is vital to analyze it. Use all possible charts and diagrams as well as the threshold values.
Threshold
A threshold is a value you can set for a metric to evaluate performance efficiently. It can be numeric (number of open issues, errors percentage) or time-related (average load time). The value can be met or exceeded, and you can visualize this information on the Real-Time Operations page.
So what are the thresholds for specific metrics listed above? In the majority of cases, you decide. Each website or app has particular requirements according to its business field, number of visitors or downloads, tech stack, storage type, etc.
However, there are some widespread thresholds you can relate to, for example, for CPU load. If CPU load indicates 80% and more, it’s critical and means the lack of power. RAM threshold is usually 85%-90%. And the threshold for the error 500 is typically 5–10%.
In contrast to RAM and CPU, thresholds for SSL certificates and disk volume remain at your convenience. We recommend setting up a critical status no fewer than seven days before SSL expiring date and considering a disk volume when establishing its threshold — the heavier your disk is, the more threshold percentage you should have.
Pay extra attention to Linux Load Averages (LA) — the system load averages that show the running thread demand on the system as an average number of running plus waiting threads. In other words, it’s a summary processes queue for all threads. LA is usually displayed as a number and not measured in anything.
You need to watch three average load numbers in dynamics: from 1 minute, 5 minutes, and 15 minutes till present. If your load increases two times and more than the number of cores, the situation has turned critical, and the system will send an alert.
Alerting

Whenever metric values change for the worse, a monitoring system informs responsible parties. This process is called alerting.
The main purpose of alerting is to bring human attention to bear on the current status and not to monitor systems 24/7. A good alert notifies proper people in time and repeats if the error arises again. Ideal alerting is about escalation.
When configuring alerts, don’t create an alert hell. Alert hell is when you set up notifications on each parameter, even the minor one. Choose no more than ten critical metrics for alerting and configure them only for a broken condition. Let responsible parties report fixed errors themselves. Avoid constant notifications — otherwise, people can stop reacting to them.
We recommend you send alerts via SMS or instant messengers and forget about emails because their delivery is often behind time. The common practice is to send notifications to group chats — however, a better option is to use mentions in group chats. This way, you both notify the responsible person and let third parties notice the alert.
When establishing a monitoring budget, consider alerting services first. Such tools as OpsGenie or PagerDuty have a perfect set of features, including shifts calendar, repeated alerting, and escalation — if a responsible party hasn’t reacted, their managers will get those alerts.
Tools
So, choosing a proper solution and using its features effectively is a significant step towards robust and superior monitoring. But how to determine whether a solution is good?
Let’s take spikes in metrics as an example. High-level tools consider them in context — if it’s a single spike for a second, a minute before, and a minute after nothing happens, they ignore it.
Another essential feature to examine is visualization — any good tool offers it. Kibana and Grafana are widespread services. Kibana presents a wide range of plugins and features, while Grafana is focused only on visualization — and copes with it gorgeously.
In case you look for advanced alerting, try Alert Manager. It’s a sophisticated yet unique tool able to make logical chains from metrics and states. Alert Manager is compatible only with Prometheus.

You can also find monitoring and alerting solutions within your cloud provider. Costs vary since each organization establishes its price tag.
Digital Ocean, for instance, has basic metrics that you can filter but can’t configure. Google Metrics, in contrast, provides configuration besides filtering. AWS presents expanded features like logs and traces and offers CloudWatch — a voluminous yet costly tool.
Speaking about Azure, you can choose from several services. Notably, Microsoft Azure Monitor collects metrics and logs to analyze availability and performance. Or Azure Service Health to monitor the status of events and plan for maintenance in advance.
However, third-party solutions as DataDog can serve as well as the native ones, offering similar features with a different interface.
And finally, we’ve got ELK — Elastic Search, LogStash, Kibana — a popular yet monstrous solution. This tech stack parses and visualizes logs and data but consumes a lot of resources. Our alternative is Prometheus, Grafana, and Loki — you’re welcome!
Summary
Study your current processes and determine the desired stack of features to start building the appropriate monitoring system. All visualization and alerting tools are highly compatible — you can select any.
Oldschool non-cloud businesses with the metrics demand can benefit from Nagios and Zabbix. Containerized and cloud environments should rely on Prometheus to adapt and scale smoothly.
Choose ELK for apps with a monitoring focus on logs. And there’s nothing better than cloud services for network apps. Is your app not containerized or a legacy one? Then your solution is Nagios, Icinga, CheckMk, or Zabbix.
In case you look for a simple setup and basic alerting — choose Host-tracker or UptimeRobot. Ready to trust your monitoring to an external service? Consider Datadog, OpsGenie, or NewRelic. And if you don’t need a paid solution, use ELK or Prometheus, Grafana, Loki stack, but be prepared to configure everything yourself.
Generally, a mix of solutions is always better than a single tool. And don’t count just on metrics. To understand processes and actions, you need to use logs and traces to analyze events. And this is quite another story ;)
